|
flrig_help
2.0.04
|
|
flrig_help
2.0.04
|
Several debugging tools are available in flrig, including the ability to observe code execution in various parts of the program.
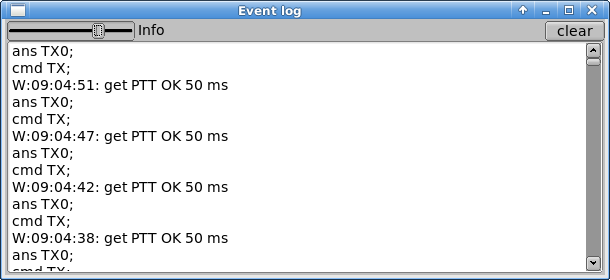
The event log is opened from the "Help/Events" menu item. It allows you to view the serial and xmlrpc data exchanges between FLRIG, FLDIGI, xmlrpc transactions, and the transceiver.
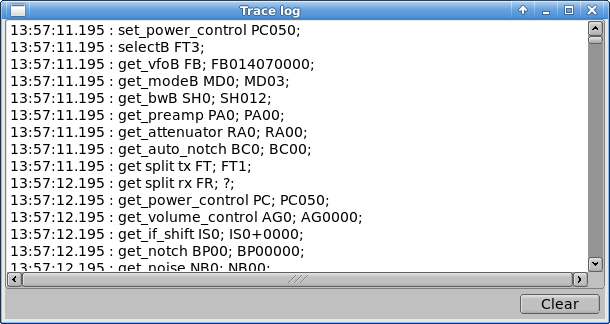
The trace tool sends time annotated data to both a viewing dialog and a file named "trace.txt" which is written to the flrig files folder. The trace tool is very useful to the programmer developing a 3rd party application using the flrig xmlrpc server. It may also be used at the request of a support person assisting the user with transceiver connection or data stream issues.