Table of Contents
Working Logs
Fldigi maintains a number of working log files that are found in its default folder. The default folder is easy to find, simply select the menu item "File/Show config" and your OS default files explorer will be opened to that location.
Rx/Tx Capture File
Everytime you start or stop fldigi that event is recorded in a daily log file. The daily log is named as:
flidigYYYYMMDD.log
where YYYYMMDD is the current GMT date. This log will also contain your entire session of Rx and Tx data annotated as to activity and time stamped. Here is a small example of the daily log:
    --- Logging started at Tue Dec 30 11:37:21 2008 UTC ---

    RX (2008-12-30 11:37Z): o ur property. No pwr even for a day is rough.
    TX (2008-12-30 11:39Z):
    TX (2008-12-30 11:39Z): CQ CQ CQ de W1HKJ W1HKJ W1HKJ
    TX (2008-12-30 11:40Z): CQ CQ CQ de W1HKJ W1HKJ W1HKJ pse k

    RX (2008-12-30 11:40Z): mG sk

    --- Logging stopped at Tue Dec 30 11:48:11 2008 UTC ---
This log is appended to with each start and stop. That means that no data is ever overwritten.
Status log
A log of errors, warnings and status reports is written for each session. This file is overwritten each time the program is opened and subsequently closed. Its format is also ASCII text and will contain data such as:
    Q: main: fldigi 3.04BV log started on Tue Dec 30 05:47:10 2008
    W: dxcc_open: Could not read contest country file "/home/dave/.fldigi/cty.dat"
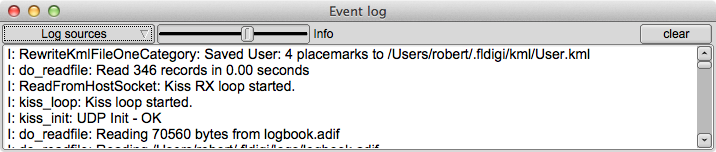
This data is identical to that which can be viewed with the event log dialog which is opened using the menu item "Help/Event log"
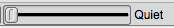
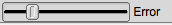
There are six levels of event logging with increasing depth of reports:
| Event Logging Levels | ||
|---|---|---|
 |
 |
 |
 |
 |
 |
The default level for logging events is "warning."
The event log show above was captured during a period of psk-reporting. Fldigi was set up to monitor and report all detected signals that satisfied the requirements of the psk reporter web site. The "spotted" signals were then automatically sent to the web site. A complete report of the recorded events was obtained by a right click in the text pane. Select-all and Save as was chosen.
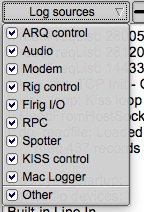
At the Debug level you will probably see more events than you need. You can select which events to suppress using the "Log sources" menu button. It defaults to all enabled.